
About This Clipart
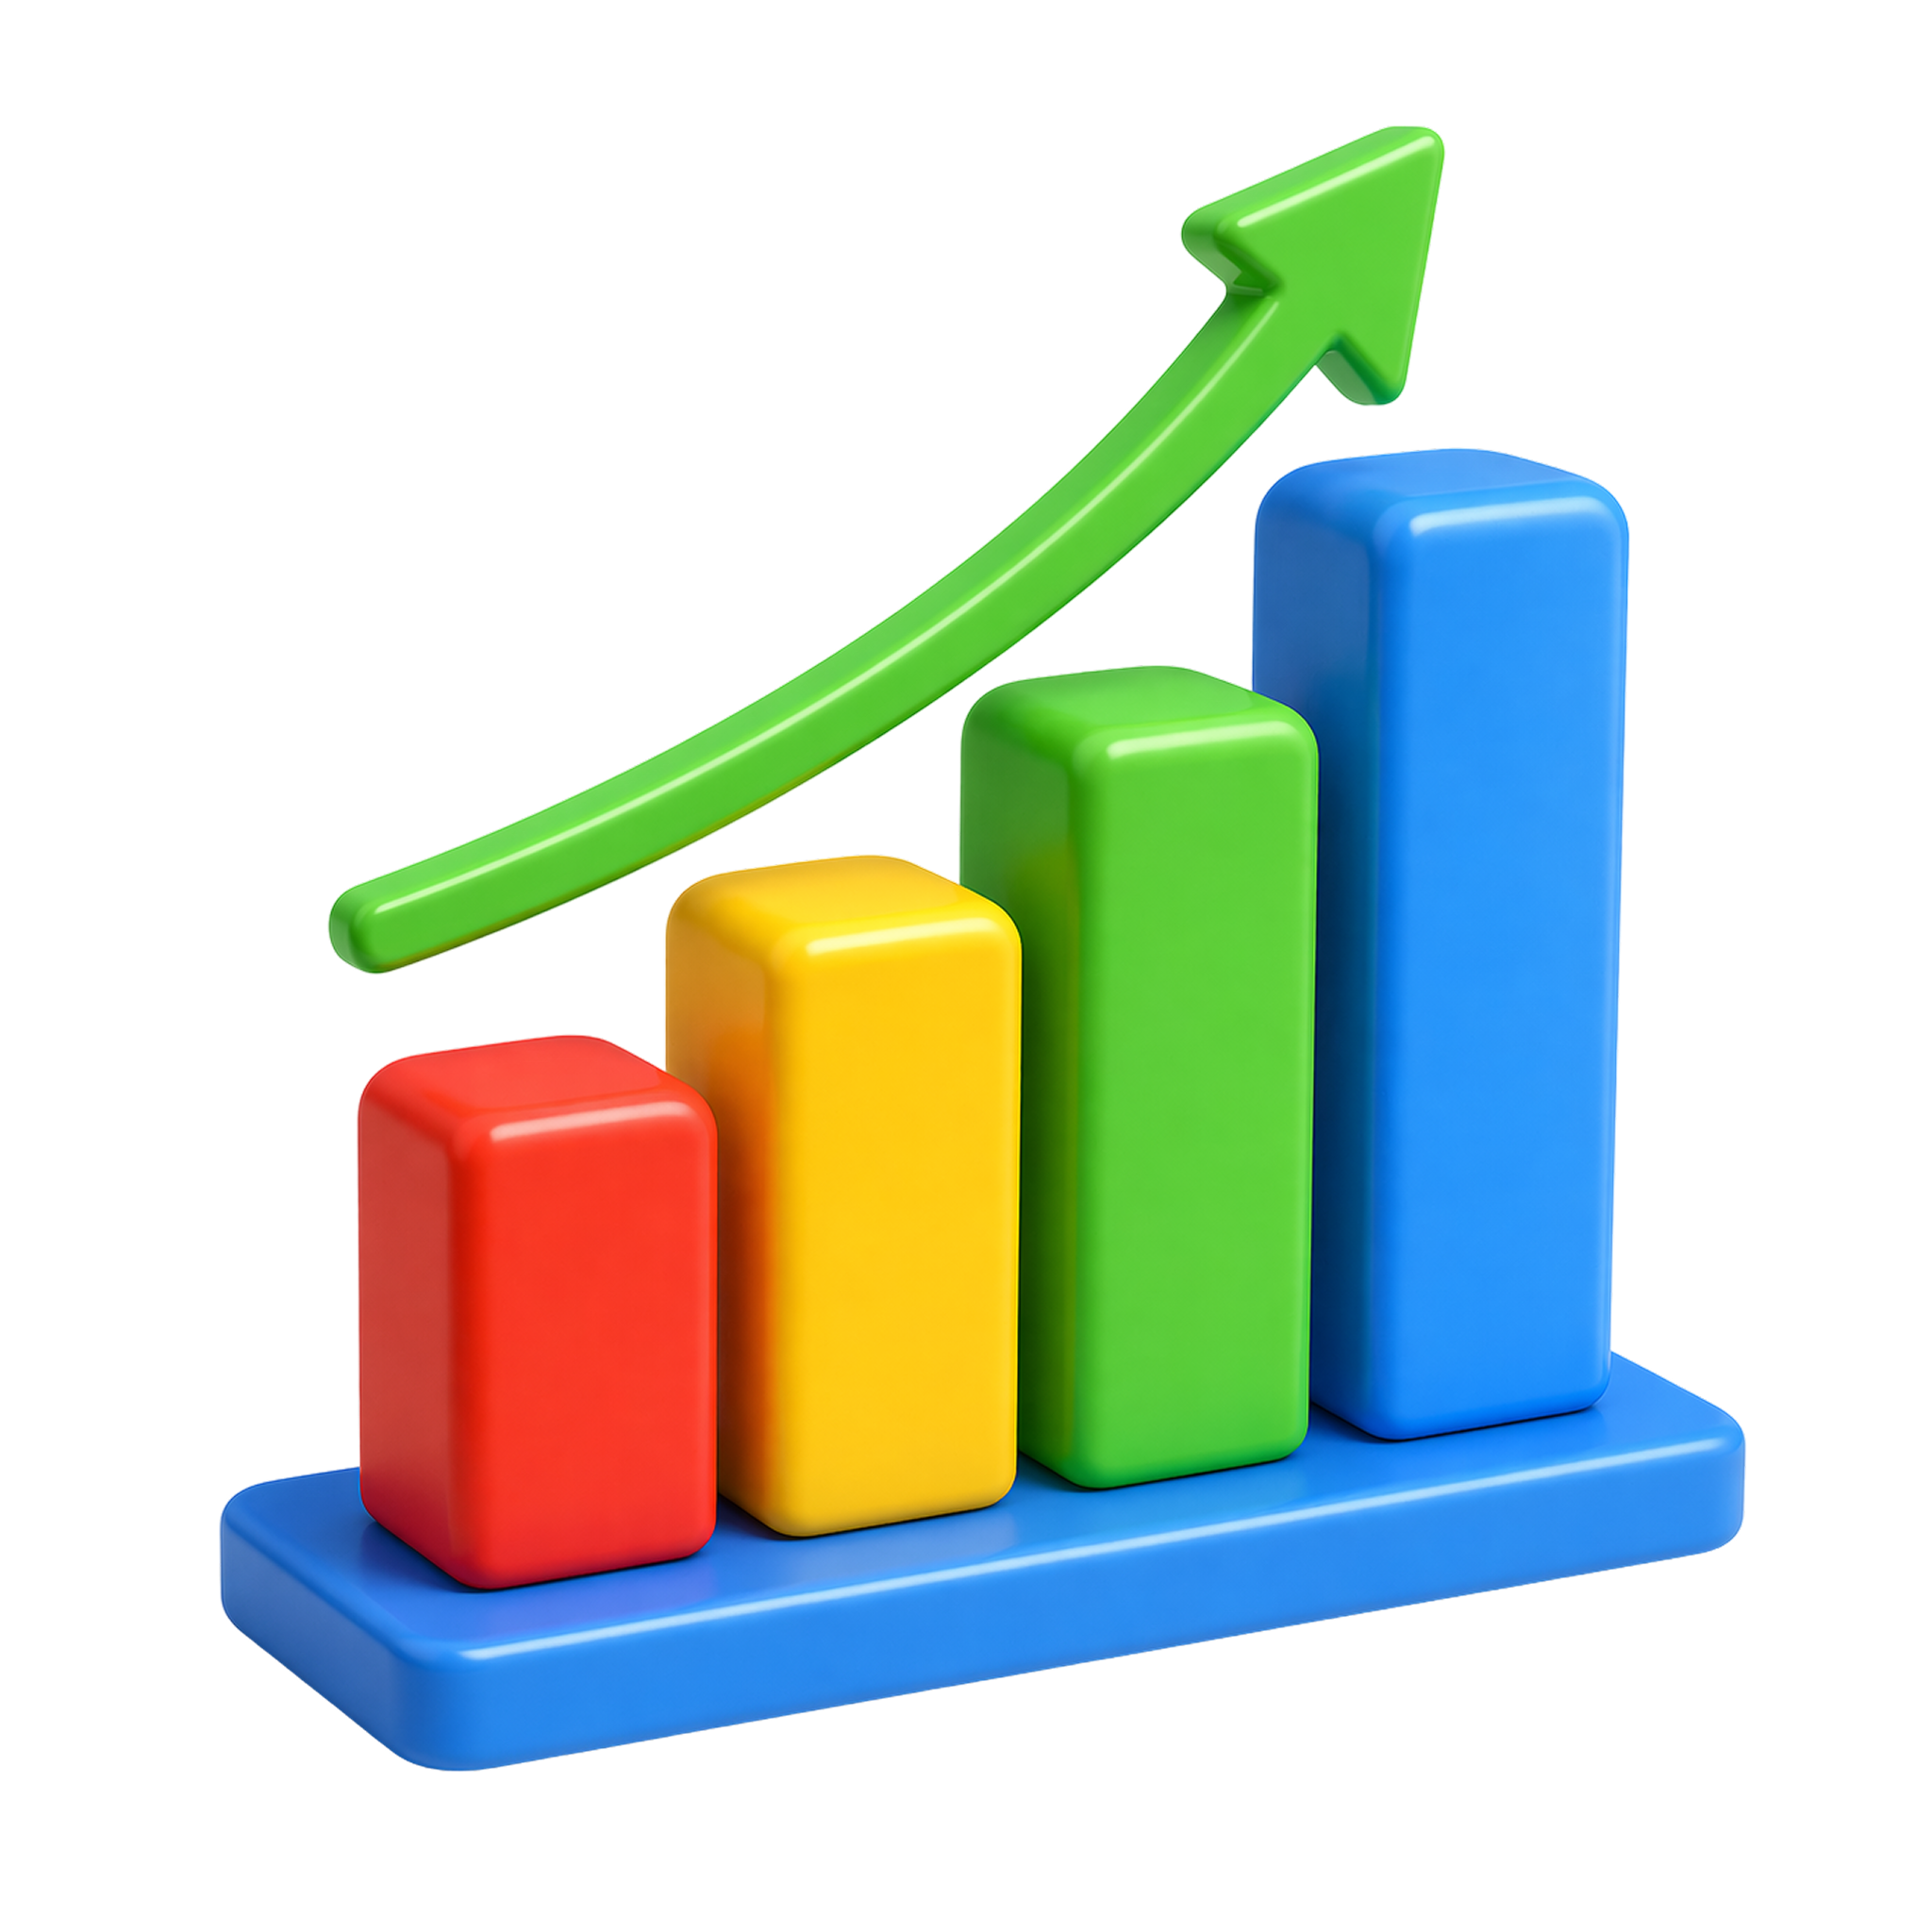
This bar graph clipart shows colorful bars increasing in height with an upward arrow, representing growth or data comparison. Bar graphs are commonly used to show information in a simple visual way, helping children understand differences and patterns.
The bright colors and clear design make it easy for young learners to recognize and interpret. This clipart is useful for introducing basic data concepts and visual learning in early math lessons.
Classroom or Activity Uses
This bar graph clipart is useful for:
- Create printable worksheets for data and graph activities
- Use in lessons about comparing values
- Add to math posters and visual aids
- Include in simple data collection activities
- Use in classroom presentations and charts
- Support homeschool data learning lessons
- Add to educational resources and teaching materials
Learning Connection
Using this clipart helps support:
- Introduces basic data representation concepts
- Helps children compare sizes and values
- Builds understanding of patterns and trends
- Supports visual learning in math
- Encourages logical thinking and observation
Quick Info
| Age Group / Grade: | Preschool – Grade 5+ |
| Subject: | Math Clipart |
| File Format: | PNG |
| Download Size: | 1.7 MB |
| Dimensions: | 2048 × 2048 px |
| License: | Free for personal/classroom use |
Free Download
High-quality Transparent PNG


Facebook
X
WhatsApp
Pinterest